
Cancer Health Disparities
Georgetown Lombardi Population Health Assessment in the Washington, D.C./New Jersey Catchment Area
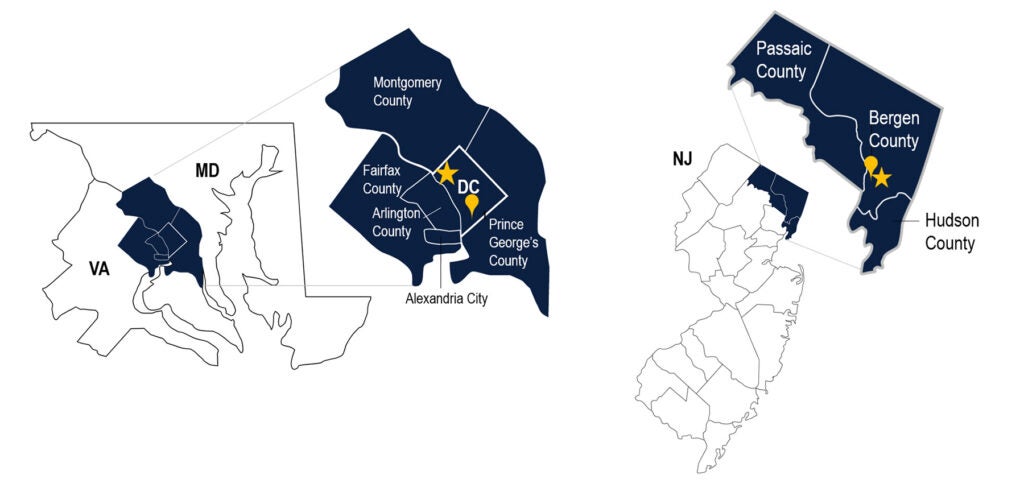
About the D.C. catchment area:
- Includes Washington, D.C., and the adjacent counties of Montgomery and Prince George’s County, Maryland; Fairfax and Arlington Counties, Virginia; and Alexandria City, Virginia
- Population: 4.3 million people
- Racial/Ethnic Composition: 31% Black, 17% Hispanic/Latino, 12% Asian, 51% White
About the New Jersey catchment area:
- Includes Bergen County and the surrounding counties of Passaic and Hudson in northern New Jersey
- Population: 2.1 million
- Racial/Ethnic Composition: 33% Hispanic/Latino, 15% Asian, 12% Black, 70% White
Cancer Burden and Mortality
The Georgetown Lombardi catchment area has lower overall cancer incidence and mortality compared to the U.S. average:
- Incidence (per 100,000): 406 (439 U.S.)
- Mortality (per 100,000): 129 (146 U.S.)
However, when broken down by cancer type, this trend does not hold:
- Incidence of female breast, prostate, uterine and pancreatic cancers are higher in the catchment area compared to the U.S. overall.
- Seven of the top 10 cancers in the catchment area (breast, prostate, colorectal, pancreatic, uterine, liver and ovarian) have higher mortality rates than the U.S. average.